bit.ly/xOuEY
As you may (or may not) have noticed, this newsletter was on “hiatus” this summer as I attended to a variety of other projects. And in retrospect, this summer was not a bad time for a hiatus. It was not a season filled with news (with respect to advanced video and TV). But as we have come to the end of summer, we’ve seen an increase in metrics releases on usage of online video, VOD and TV platforms.
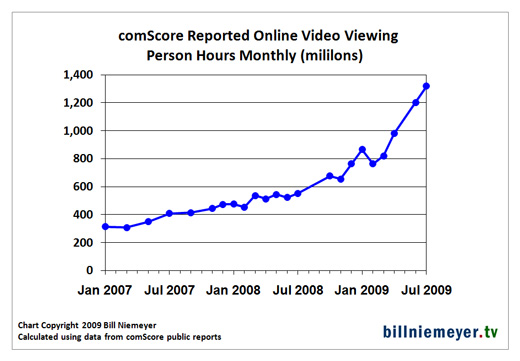
The metrics that most got my attention were in press releases from comScore’s online video measurement service Video Metrix on data for June and July, showing a dramatic ramp up in usage. The comScore data suggests a "hockey stick" style increase in online video use is underway.
And while I’d like to believe that’s true, Nielsen NetRatings VideoCensus online video data isn’t showing it. An added element of concern… some of the comScore reported increases for June/July for specific media properties are unusually sizeable (as in really really big).
comScore reported June video streams came in at 19.5 billion (up 81% vs. a year ago and 17% vs. April 2009 – comScore didn’t release data for May). July video streams were 21.4 billion, another 10% jump vs. June and 87% vs. a year ago.
Combine this with comScore’s reported 28% increase in average video stream length from July 2008 to July 2009 (2.9 min. to 3.7 min.), and you get a remarkable 139% increase in total time spent watching online video in July vs. a year ago.
Here’s a graph showing total time spent watching video, based on my calculations using comScore Video Metrix press release data going back to January 2007.
So are we seeing a genuine “hockey stick” in online video use?
Maybe… but data from Nielsen’s NetRatings VideoCensus doesn’t show such a dramatic increase. Here’s a comparison of comScore and Nielsen data for July (the comparison is very similar for June).
|
|
July 2009 |
Year Over Year |
|
comScore Video Metrix |
|
|
|
Video Streams (millions) |
21,371 |
87% |
|
Video Streamers (millions) |
158.4 |
11% |
|
Total Person Hours (millions) |
1,318 |
139% |
|
Nielsen VideoCensus |
|
|
|
Video Streams (millions) |
11,200 |
31% |
|
Video Streamers (millions) |
136.0 |
14% |
|
Total Person Hours (millions) |
480 |
62% |
There are stated differences in methodology. Nielsen says it does not count progressive downloads or advertisements – comScore does. But ads or progressive downloads alone are not going to account for the almost 2 to 1 difference in July video streams.
But what’s most striking is the large difference in trends. comScore is showing much greater year over year increases in video streams (87% vs. Nielsen’s 31%) and total time viewing (139% vs. Nielsen’s 62%).
Contributing to this difference is that comScore is showing a very large increase in traffic to some large video providers from the March/April period to June/July. See below.
|
Video Streams (millions) |
|||||
|
|
Mar-09 |
Apr-09 |
May-09 |
Jun-09 |
Jul-09 |
|
comScore Data |
|
|
|
|
|
|
Viacom Digital |
277,753 |
315,177 |
n/a |
773,554 |
812,343 |
|
Microsoft |
288,329 |
288,301 |
n/a |
695,661 |
630,631 |
|
Turner Networks |
167,323 |
272,709 |
n/a |
496,101 |
390,848 |
|
Nielsen Data |
|
|
|
|
|
|
Nickelodeon Kids and Family Network |
196,160 |
175,917 |
153,414 |
156,923 |
179,666 |
|
MTV Networks Music |
123,888 |
143,356 |
126,929 |
138,048 |
119,101 |
|
MSN/Windows Live/Bing |
168,907 |
164,422 |
148,358 |
195,597 |
187,994 |
|
Turner Sports and Entertainment Digital Network |
137,621 |
130,599 |
141,350 |
150,150 |
155,075 |
|
CNN Digital Network |
103,453 |
112,469 |
n/a |
103,313 |
109,221 |
From April to June, comScore says Turner’s streams went up 82%, Microsoft’s 142% and Viacom’s 145%. These are dramatic increases not reflected in the Nielsen data.
The June comScore press release attributes the increase to major news stories, citing Michael Jackson and the Iranian elections. But, the combined Viacom/MSFT/Turner increase from April to June was over one billion streams. That’s a lot to account for given the July 7 Michael Jackson memorial service generated 10 million live streams for CNN and MSNBC reported a total 19 million video streams the day of the memorial. Large single day numbers certainly, but since the Iranian elections and even Michael Jackson’s passing had finite length news cycles of a few weeks, it’s hard to see where the extra billion streams in both June and July are coming from.
This begs the question… how much of comScore’s reported sharp increases in traffic into June and July were driven by methodology changes rather than just consumer usage trends? This is not to say that Nielsen is right and comScore is wrong (or vice versa). Both have been on the receiving end of public and private criticism from some major content providers over how they measure online video.
Granted, online video measurement is still a nascent space. On the other hand, we’re several years into the rise of online video and likely approaching one billion dollars a year in online video ad spend. It would behoove the online video industry to work jointly to establish more consistency in how topline traffic levels and trends are reported.
It’s not good for online video as a business when the two largest providers of measurement are differing by 2X in publicly reported traffic numbers and 2X in year-over-year rates of increase. Over time, this will get sorted. But in the meantime, consider carefully while using publicly reported video usage numbers for various plans, pitches and prognostications.
