Is Online Video Use Hockey Sticking? Or Not? comScore vs. Nielsen data…

bit.ly/xOuEY

As you may (or may not) have noticed, this newsletter was on “hiatus” this summer as I attended to a variety of other projects. And in retrospect, this summer was not a bad time for a hiatus. It was not a season filled with news (with respect to advanced video and TV). But as we have come to the end of summer, we’ve seen an increase in metrics releases on usage of online video, VOD and TV platforms.

The metrics that most got my attention were in press releases from comScore’s online video measurement service Video Metrix on data for June and July, showing a dramatic ramp up in usage.  The comScore data suggests a "hockey stick" style increase in online video use is underway.

And while I’d like to believe that’s true, Nielsen NetRatings VideoCensus online video data isn’t showing it.  An added element of concern… some of the comScore reported increases for June/July for specific media properties are unusually sizeable (as in really really big).

comScore reported June video streams came in at 19.5 billion (up 81% vs. a year ago and 17% vs. April 2009 – comScore didn’t release data for May).  July video streams were 21.4 billion, another 10% jump vs. June and 87% vs. a year ago.

Combine this with comScore’s reported 28% increase in average video stream length from July 2008 to July 2009 (2.9 min. to 3.7 min.), and you get a remarkable 139% increase in total time spent watching online video in July vs. a year ago.

Here’s a graph showing total time spent watching video, based on my calculations using comScore Video Metrix press release data going back to January 2007.

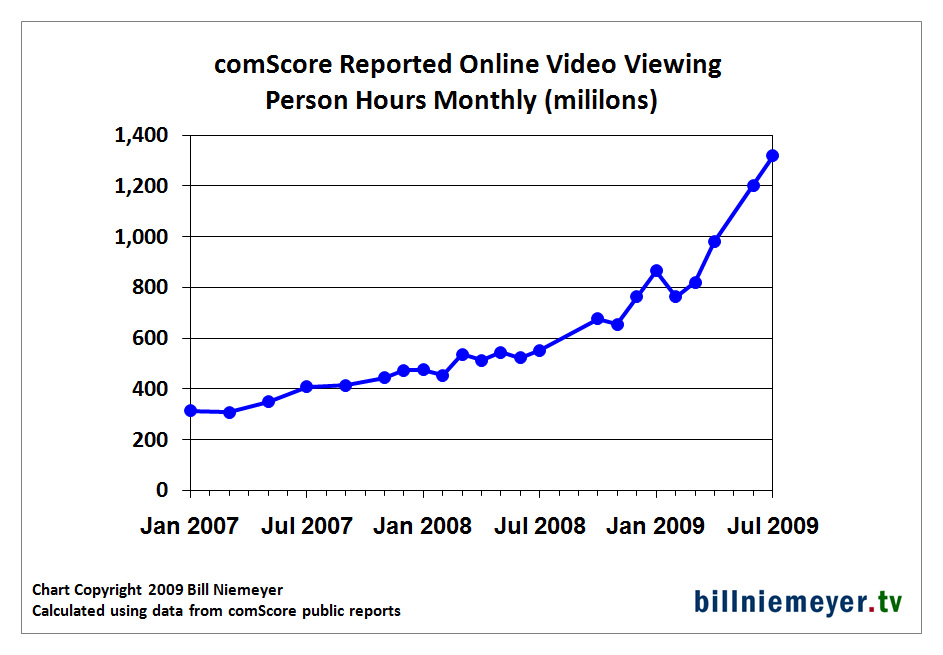
So are we seeing a genuine “hockey stick” in online video use?

Maybe… but data from Nielsen’s NetRatings VideoCensus doesn’t show such a dramatic increase. Here’s a comparison of comScore and Nielsen data for July (the comparison is very similar for June).


July 2009

Year Over Year

comScore Video Metrix


Video Streams (millions)

21,371

87%

Video Streamers (millions)

158.4

11%

Total Person Hours (millions)

1,318

139%

Nielsen VideoCensus


Video Streams (millions)

11,200

31%

Video Streamers (millions)

136.0

14%

Total Person Hours (millions)

480

62%

There are stated differences in methodology. Nielsen says it does not count progressive downloads or advertisements – comScore does. But ads or progressive downloads alone are not going to account for the almost 2 to 1 difference in July video streams.

But what’s most striking is the large difference in trends. comScore is showing much greater year over year increases in video streams (87% vs. Nielsen’s 31%) and total time viewing (139% vs. Nielsen’s 62%).

Contributing to this difference is that comScore is showing a very large increase in traffic to some large video providers from the March/April period to June/July. See below.

Video Streams (millions)


Mar-09

Apr-09

May-09

Jun-09

Jul-09

comScore Data


Viacom Digital

277,753

315,177

n/a

773,554

812,343

Microsoft

288,329

288,301

n/a

695,661

630,631

Turner Networks

167,323

272,709

n/a

496,101

390,848

Nielsen Data


Nickelodeon Kids and Family Network

196,160

175,917

153,414

156,923

179,666

MTV Networks Music

123,888

143,356

126,929

138,048

119,101

MSN/Windows Live/Bing

168,907

164,422

148,358

195,597

187,994

Turner Sports and Entertainment Digital Network

137,621

130,599

141,350

150,150

155,075

CNN Digital Network

103,453

112,469

n/a

103,313

109,221

From April to June, comScore says Turner’s streams went up 82%, Microsoft’s 142% and Viacom’s 145%. These are dramatic increases not reflected in the Nielsen data.

The June comScore press release attributes the increase to major news stories, citing Michael Jackson and the Iranian elections. But, the combined Viacom/MSFT/Turner increase from April to June was over one billion streams. That’s a lot to account for given the July 7 Michael Jackson memorial service generated 10 million live streams for CNN and MSNBC reported a total 19 million video streams the day of the memorial. Large single day numbers certainly, but since the Iranian elections and even Michael Jackson’s passing had finite length news cycles of a few weeks, it’s hard to see where the extra billion streams in both June and July are coming from.

This begs the question… how much of comScore’s reported sharp increases in traffic into June and July were driven by methodology changes rather than just consumer usage trends? This is not to say that Nielsen is right and comScore is wrong (or vice versa). Both have been on the receiving end of public and private criticism from some major content providers over how they measure online video.

Granted, online video measurement is still a nascent space. On the other hand, we’re several years into the rise of online video and likely approaching one billion dollars a year in online video ad spend. It would behoove the online video industry to work jointly to establish more consistency in how topline traffic levels and trends are reported.

It’s not good for online video as a business when the two largest providers of measurement are differing by 2X in publicly reported traffic numbers and 2X in year-over-year rates of increase.  Over time, this will get sorted. But in the meantime, consider carefully while using publicly reported video usage numbers for various plans, pitches and prognostications.

Please WSJ, Just Say No To Cord Cutting Hype (Metrics Say DVR Matters Much More)

tinyurl.com/ox4sp3

Nielsen recently released the Q1 09 edition of their series of A2/M2 Three Screen Reports on usage of TV, DVR, online video and mobile video (you can download the latest PDF here).  I’ve run some calculations against that data – see below for charts and the trends they indicate.

And just in time to raise my ire in this newsletter, on Thursday the Wall St. Journal ran this article – More Households Cut the Cord on Cable (going online video only).  Reading it, I began to feel like an advanced video colleague of the unintelligible cranky prospector from Mel Brooks’ "Blazing Saddles." Because while cord cutting may make for an attention getting tech meme, right now it’s an over-hyped trend in a small number of households that simply isn’t showing up in the quantitative data. The recent Nielsen report is one more source that shows it’s not having a measurable impact on TV consumption in the US.  Meanwhile, there is a platform that is having a measurable impact on TV right now – it’s DVR (see below for the metrics).

It’s true that cable is slowly but steadily losing subscribers (and losing TV household market share even faster – see this edition of the newsletter for those metrics).  But adoption of satellite TV and IPTV is more than making up for that – the total number of people subscribing to multi-channel TV continues to rise. 

Certainly, technology solutions that provide mass-market consumer friendly, high quality "Internet video to TV" are clearly coming.  But whether or not that leads to widespread "cord cutting" (a terrible term for this) will depend on shifts in content distribution, business practices and consumer behavior, not just technology. An example of a current roadblock – you lose access to much of TV programming if you "cord cut" – for a look at this see the newsletter issue "Indexing Cord Cut-ability – How Much TV Do You Lose Going Online-Only?"

On to the analysis of the Nielsen A2/M2 Three Screen Reports on usage of TV, DVR, online video and mobile video…

The reports focus on average per person usage, but I wanted to know what the reports had to say about total viewing of on each of the platforms. I ran some calculations – here’s a chart of total TV consumption (on a person hours basis).

TV viewing by quarter

(click to view larger)

TV consumption continues to go up. You do see seasonality in spring and summer (turn off that TV and get out of the house!) and Q1 08 was potentially diminished by the writer’s strike. But for the past three quarters we’re seeing year over year increases.  Cord cutting, where are you?

Next, I took a look at person-hours of viewing of timeshifted TV, online video and mobile video.  (Nielsen’s definition of "timeshifted TV" includes DVRs, DVD recorders and "Start Over" like VOD services – right now, that’s undoubtedly effectively all DVR use.) 

Here’s a chart of those calculations, as a percent of total TV viewing.

TV viewing by quarter

(click to view larger)

Online video viewing of all kinds is still less than 1% of TV viewing. DVR continues to be the "new" video platform having the biggest impact at 5.4% of TV viewing. (DVR is still "new"? It’s been 10 years since ReplayTV first hit store shelves followed shortly by TiVo.)

What can we infer about future trends from this Nielsen data?

  • Mobile is the fastest growing video platform – usage up 166% in Q2 09 vs. Q1 08.  But some of that growth could well be issues in the very nascent business of measuring mobile video.  And at 0.1% of TV usage, mobile has some way to go before it can be a notable contributor.
  • Online video is growing quickly – usage up 74% in Q1 09 vs. a year ago.
  • But… timeshifted TV use is growing quickly too – usage up 42% in Q1 09 vs. Q1 08.

This is the big challenge for TV networks and stations trying to use online video to replace revenues lost due to DVR ad skipping.  While online video is growing quickly, DVR use is not a stationary target.  Plus, DVRs are the best thing to happen to TV watching since color TV and the remote. It’s a high quality, easy to get, moderate cost on-demand platform with access to 100% of TV shows.

You might be saying… 5.4% DVR timeshifting is still not that much compared to overall TV use.  Especially considering that about 40% of ads in timeshifted viewing are viewed in real time within three days and programmers therefore can be paid for them.

But that 5.4% timeshifting is the share of all TV viewing in all dayparts in all age cohorts. People 65 and over are skewing that number down – they only timeshifted 2.1% of their viewing, but they represent a remarkable 23% of all TV viewing.  In the age ranges and programming categories that matter most to TV ad buyers, DVR timeshifting gets bigger (and in some cases – very big).

Some examples of DVR timeshifting as a share of TV viewing:

  • 5.4% – all viewing by all people 2+ (Q1 09 – Nielsen A2/M2 Three Screen Report)
  • 7.5% – all viewing by 35-44s (above report)
  • 8.5% – all viewing by 25-34s (above report)
  • 11.5% – primetime broadcast "five net" viewing by all people 2+ (Magna Global report on Nielsen November sweeps ratings – 10/30/08 to 11/26/08)
  • 18.1% – primetime broadcast "five net" viewing by 18-49s (above Magna report)

And, some remarkable data for selected primetime broadcast shows (from this article from a great website for the TV numbers wonk – tvbythenumbers.com – highly recommended!)

DVR timeshifting as a share of all 18-49 viewing – week of 4/6 – 4/12/09:

  • 48% – for a "special" episode of NBC’s "The Office"
  • 44% – for FOX’s "Terminator"
  • 42% – for ABC’s "Lost"
  • 30% – for CBS’s "Survivor" (reality shows not immune…)

While an overall 5.4% of all TV viewing being timeshifted may not seem like a large impact, almost 50% of "The Office" episode’s 18-49 viewing being timeshifted absolutely is.  Given "The Office" (and most of primetime broadcast) is likely sold against 18-49 C3 ratings (commercial three day), NBC probably saw almost 30% of the ad inventory in that episode wiped out by DVR timeshifting.

It’s only going to get bigger.  We’re currently at 31% of US households having DVRs – my estimate is we’ll hit 50% at the end of 2011.

While TV programmers and advertisers absolutely need to pursue initiatives in online and mobile video, and prepare for "cord cutting"/"over the top" delivery models, they also need to act with regards to their biggest "new platform" impact today – DVR timeshifting.  To do this, they need the cooperation of multichannel operators (cable, satellite and telco IPTV) to enable enhanced DVR advertising – not only to mitigate the ad revenue losses but to leverage timeshifted viewing to drive increased advertising revenues.

Today’s Cable TV “Revenue Split” and Why Over The Top Likely Can’t Be Ad-Supported Only

tinyurl.com/pw4us9

Unsurprisingly, the ABC/Hulu deal of two weeks ago got my attention (some interesting insights on that from Bob Iger in the transcript of last week’s Disney earnings call).  But, one aspect of the deal in particular got my quantitative interest.  It was the long-form TV content online deal ABC elected not do – with YouTube.  Several press articles (including "Disney’s Hulu Deal Raises Questions About YouTube Model" via the WSJ) indicated ABC decided not do a long form deal with YouTube in part because they offered a revenue share only agreement – YouTube not being willing to pay fees or provide equity participation.

This prompted me to consider, towards a compare/contrast with online TV content deals – what’s the "revenue share" in television?  I put that in quotes because most TV agreements are based on advertising inventory shares (known as an avail split), often combined with fees.  Avail splits keep the parties involved from having to get into each other’s business – you sell your inventory and I’ll sell mine.  Avail splits also support national and local sales forces doing what they do best.

Nonetheless, what is the "effective" TV revenue share – where do the dollars come from and who gets them?  And what does that tell us about whether or not online TV content models –  especially with respect to "over the top" platforms (Internet delivered video to TVs) – can be viable with advertising revenues alone or must they go "dual revenue" as cable TV has, namely charge subscription fees as well?

A warning… the quantitative analysis can get messy quickly.  But the qualitative takeaway becomes evident even more quickly – so I’ll present it first. 

Because such a large share of cable TV revenues ultimately come from multichannel subscriber fees (and broadcast TV is increasingly moving to an analogous model via retransmission fees), TV content likely cannot be monetized online via advertising models alone as online video use grows.  Especially as "over the top" platforms come to market and Internet delivered TV programming moves from being additive to being cannibalistic (as it inevitably must as share of viewing increases) – it’s probable the dual revenue model of advertising plus carriage fees must follow from TV platforms to online.

Here’s a stepwise back of the envelope look at the numbers for cable networks.

Version #1 – revenue split – cable network/operator – advertising only

It’s 81/19.  Cable networks national ad sales in 2008 were $21 billion (estimate from Magna Global).  Multichannel operator sales of cable network local avails in 2008 were $4.7 billion (based on an NCTA estimate for cable and my estimate for satellite and IPTV).  A total of $26 billion – the networks get $21B or 81%.

But… that doesn’t include cable network carriage fees.

Version #2 – revenue split – cable network/operator – advertising and carriage fees

It’s 90/10.  My estimate is cable networks got $24 billion in carriage fees from multichannel operators in 2008.  Added to a total 2008 cable network ad market of $26 billion (see above), that’s a revenue base of $50 billion and the cable networks got 90% of that ($45B total – $24B in fees and $21B in national ad sales).

But… that doesn’t include the revenues multichannel operators get from subscriber fees.

Version #3 – revenue split – cable network/operator – advertising, carriage fees and operator subscriber fees

It’s 63/37 – maybe. Multichannel operators generated $83 billion in video subscriber revenues in 2008 (NCTA says cable was $52B, DIRECTV reported $17B, DISH reported $12B, I estimate AT&T plus Verizon was $2B).  I say we should subtract fees paid for premium channel subscriptions and pay-per-view – I estimate that’s about $15 billion.  That leaves $68 billion.  Now things get fuzzy. You need to figure out what share of the remaining $68 billion is being paid for access to cable network content, add that to the advertising revenue base, and split it out.  Here’s a simple (and probably wrong) way to do that.  I estimate cable networks are about 2/3 of total TV ratings points in multichannel households (using Nielsen data via the CAB web site).  2/3 of $68 billion in subscriber fees is $45 billion – add that to the overall cable ad revenue of $26 billion (see version #1) for a total revenue base of $71 billion.  Cable networks get $45 billion in national ads and carriage fees (see version #2) for a share of 63%.

You could do this calculation much more rigorously (estimating consumer perceived value of cable networks, fees for set-tops and DVRs and so on) but here’s the good news – towards the topline question of whether or not "over the top" business models will likely need to include subscriber fees – I don’t think you have to.

That question seems to have been answered by the version #2 calculations. Cable networks are getting over 50% of their revenues from carriage fees paid by operators.  If an online TV platform wanted to go "ad only," it could double the advertising revenue production per viewing hour of cable TV and it would still have to give it all to cable networks to provide them close to the same revenue they get from TV platforms.

Online platforms that provide additive viewing for cable and broadcast networks have a lower bar – they don’t need to match TV in revenue.  But as Internet-delivered viewing of TV programming gains market share via platforms like "over the top" – it will necessarily draw viewers away from traditional TV platforms to get that share.

Certainly, advanced digital video advertising techniques need to be employed to drive better revenue generation than linear 30 second commercials can provide (see this past Niemeyer Review newsletter for more).  But in order to provide the "dual" revenues that currently support cable (and increasingly broadcast) TV programming, it seems likely that "over the top" platforms will also have to charge subscription fees.  How those platforms can provide value to customers to gain subscription fees, while delivering added value for marketers to drive advertising revenues, are two key topics to be addressed for "over the top" business models.