Is Online Video Use Hockey Sticking? Or Not? comScore vs. Nielsen data…

Is Online Video Use Hockey Sticking? Or Not? comScore vs. Nielsen data…

bit.ly/xOuEY

As you may (or may not) have noticed, this newsletter was on “hiatus” this summer as I attended to a variety of other projects. And in retrospect, this summer was not a bad time for a hiatus. It was not a season filled with news (with respect to advanced video and TV). But as we have come to the end of summer, we’ve seen an increase in metrics releases on usage of online video, VOD and TV platforms.

The metrics that most got my attention were in press releases from comScore’s online video measurement service Video Metrix on data for June and July, showing a dramatic ramp up in usage.  The comScore data suggests a "hockey stick" style increase in online video use is underway.

And while I’d like to believe that’s true, Nielsen NetRatings VideoCensus online video data isn’t showing it.  An added element of concern… some of the comScore reported increases for June/July for specific media properties are unusually sizeable (as in really really big).

comScore reported June video streams came in at 19.5 billion (up 81% vs. a year ago and 17% vs. April 2009 – comScore didn’t release data for May).  July video streams were 21.4 billion, another 10% jump vs. June and 87% vs. a year ago.

Combine this with comScore’s reported 28% increase in average video stream length from July 2008 to July 2009 (2.9 min. to 3.7 min.), and you get a remarkable 139% increase in total time spent watching online video in July vs. a year ago.

Here’s a graph showing total time spent watching video, based on my calculations using comScore Video Metrix press release data going back to January 2007.

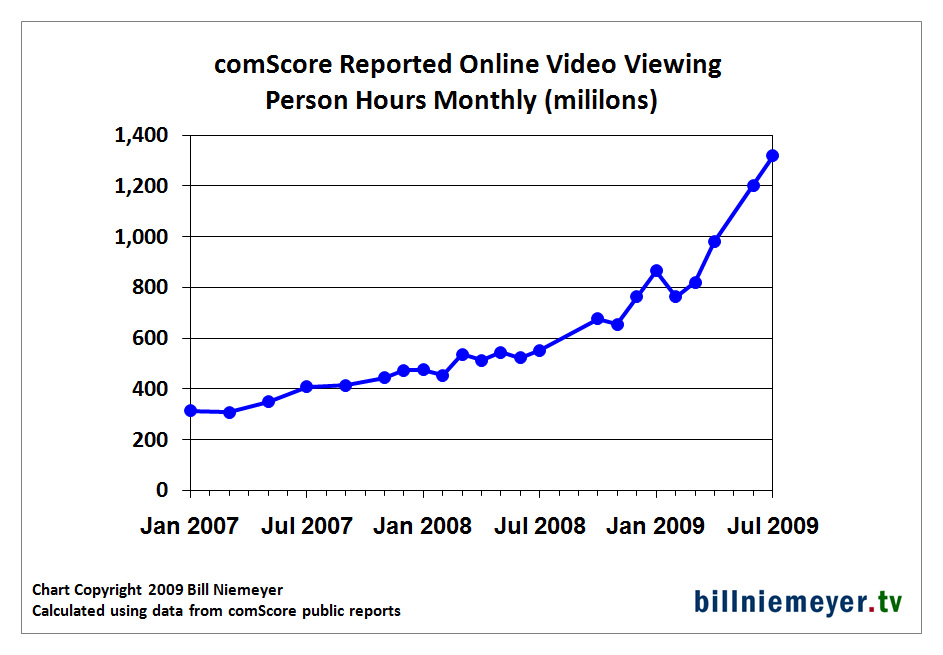
So are we seeing a genuine “hockey stick” in online video use?

Maybe… but data from Nielsen’s NetRatings VideoCensus doesn’t show such a dramatic increase. Here’s a comparison of comScore and Nielsen data for July (the comparison is very similar for June).

Continue reading “Is Online Video Use Hockey Sticking? Or Not? comScore vs. Nielsen data…”

Please WSJ, Just Say No To Cord Cutting Hype (Metrics Say DVR Matters Much More)

Please WSJ, Just Say No To Cord Cutting Hype (Metrics Say DVR Matters Much More)

tinyurl.com/ox4sp3

Nielsen recently released the Q1 09 edition of their series of A2/M2 Three Screen Reports on usage of TV, DVR, online video and mobile video (you can download the latest PDF here).  I’ve run some calculations against that data – see below for charts and the trends they indicate.

And just in time to raise my ire in this newsletter, on Thursday the Wall St. Journal ran this article – More Households Cut the Cord on Cable (going online video only).  Reading it, I began to feel like an advanced video colleague of the unintelligible cranky prospector from Mel Brooks’ "Blazing Saddles." Because while cord cutting may make for an attention getting tech meme, right now it’s an over-hyped trend in a small number of households that simply isn’t showing up in the quantitative data. The recent Nielsen report is one more source that shows it’s not having a measurable impact on TV consumption in the US.  Meanwhile, there is a platform that is having a measurable impact on TV right now – it’s DVR (see below for the metrics).

It’s true that cable is slowly but steadily losing subscribers (and losing TV household market share even faster – see this edition of the newsletter for those metrics).  But adoption of satellite TV and IPTV is more than making up for that – the total number of people subscribing to multi-channel TV continues to rise. 

Certainly, technology solutions that provide mass-market consumer friendly, high quality "Internet video to TV" are clearly coming.  But whether or not that leads to widespread "cord cutting" (a terrible term for this) will depend on shifts in content distribution, business practices and consumer behavior, not just technology. An example of a current roadblock – you lose access to much of TV programming if you "cord cut" – for a look at this see the newsletter issue "Indexing Cord Cut-ability – How Much TV Do You Lose Going Online-Only?"

On to the analysis of the Nielsen A2/M2 Three Screen Reports on usage of TV, DVR, online video and mobile video…

The reports focus on average per person usage, but I wanted to know what the reports had to say about total viewing of on each of the platforms. I ran some calculations – here’s a chart of total TV consumption (on a person hours basis).

TV viewing by quarter

(click to view larger)

Continue reading “Please WSJ, Just Say No To Cord Cutting Hype (Metrics Say DVR Matters Much More)”

Today’s Cable TV “Revenue Split” and Why Over The Top Likely Can’t Be Ad-Supported Only

Today’s Cable TV “Revenue Split” and Why Over The Top Likely Can’t Be Ad-Supported Only

tinyurl.com/pw4us9

Unsurprisingly, the ABC/Hulu deal of two weeks ago got my attention (some interesting insights on that from Bob Iger in the transcript of last week’s Disney earnings call).  But, one aspect of the deal in particular got my quantitative interest.  It was the long-form TV content online deal ABC elected not do – with YouTube.  Several press articles (including "Disney’s Hulu Deal Raises Questions About YouTube Model" via the WSJ) indicated ABC decided not do a long form deal with YouTube in part because they offered a revenue share only agreement – YouTube not being willing to pay fees or provide equity participation.

This prompted me to consider, towards a compare/contrast with online TV content deals – what’s the "revenue share" in television?  I put that in quotes because most TV agreements are based on advertising inventory shares (known as an avail split), often combined with fees.  Avail splits keep the parties involved from having to get into each other’s business – you sell your inventory and I’ll sell mine.  Avail splits also support national and local sales forces doing what they do best.

Nonetheless, what is the "effective" TV revenue share – where do the dollars come from and who gets them?  And what does that tell us about whether or not online TV content models –  especially with respect to "over the top" platforms (Internet delivered video to TVs) – can be viable with advertising revenues alone or must they go "dual revenue" as cable TV has, namely charge subscription fees as well?

A warning… the quantitative analysis can get messy quickly.  But the qualitative takeaway becomes evident even more quickly – so I’ll present it first. 

Because such a large share of cable TV revenues ultimately come from multichannel subscriber fees (and broadcast TV is increasingly moving to an analogous model via retransmission fees), TV content likely cannot be monetized online via advertising models alone as online video use grows.  Especially as "over the top" platforms come to market and Internet delivered TV programming moves from being additive to being cannibalistic (as it inevitably must as share of viewing increases) – it’s probable the dual revenue model of advertising plus carriage fees must follow from TV platforms to online.

Here’s a stepwise back of the envelope look at the numbers for cable networks.

Version #1 – revenue split – cable network/operator – advertising only

Continue reading “Today’s Cable TV “Revenue Split” and Why Over The Top Likely Can’t Be Ad-Supported Only”